12.1 Demographics: The Future is already Zoned
The Future Is Already Zoned
How the Twin Cities tries to forecast 2050, and why a prediction about population quickly becomes an argument about apartments, sewers, migration, aging, local politics, and what can be built on one particular piece of ground.

By the end of this reading, you should be able to...
A fortune teller with a zoning map
Talking to a demographer can feel a bit like asking a Minnesota farmer what the weather will be next month. You receive a careful answer, several qualifications, and the strong impression that the speaker knows more than they are willing to promise. That is not evasion. It is the honest shape of the problem.
A forecast is not a photograph mailed backward from 2050. It is a model. The model begins with the national economy, employment, births, deaths, aging, and migration. Then it asks where the resulting people, households, and jobs are likely to locate. At that moment, the apparently abstract future runs into the physical Twin Cities: land prices, transit lines, sewer capacity, travel times, zoning rules, lakes, highways, existing buildings, and developers who prefer to build something that recently succeeded somewhere nearby.
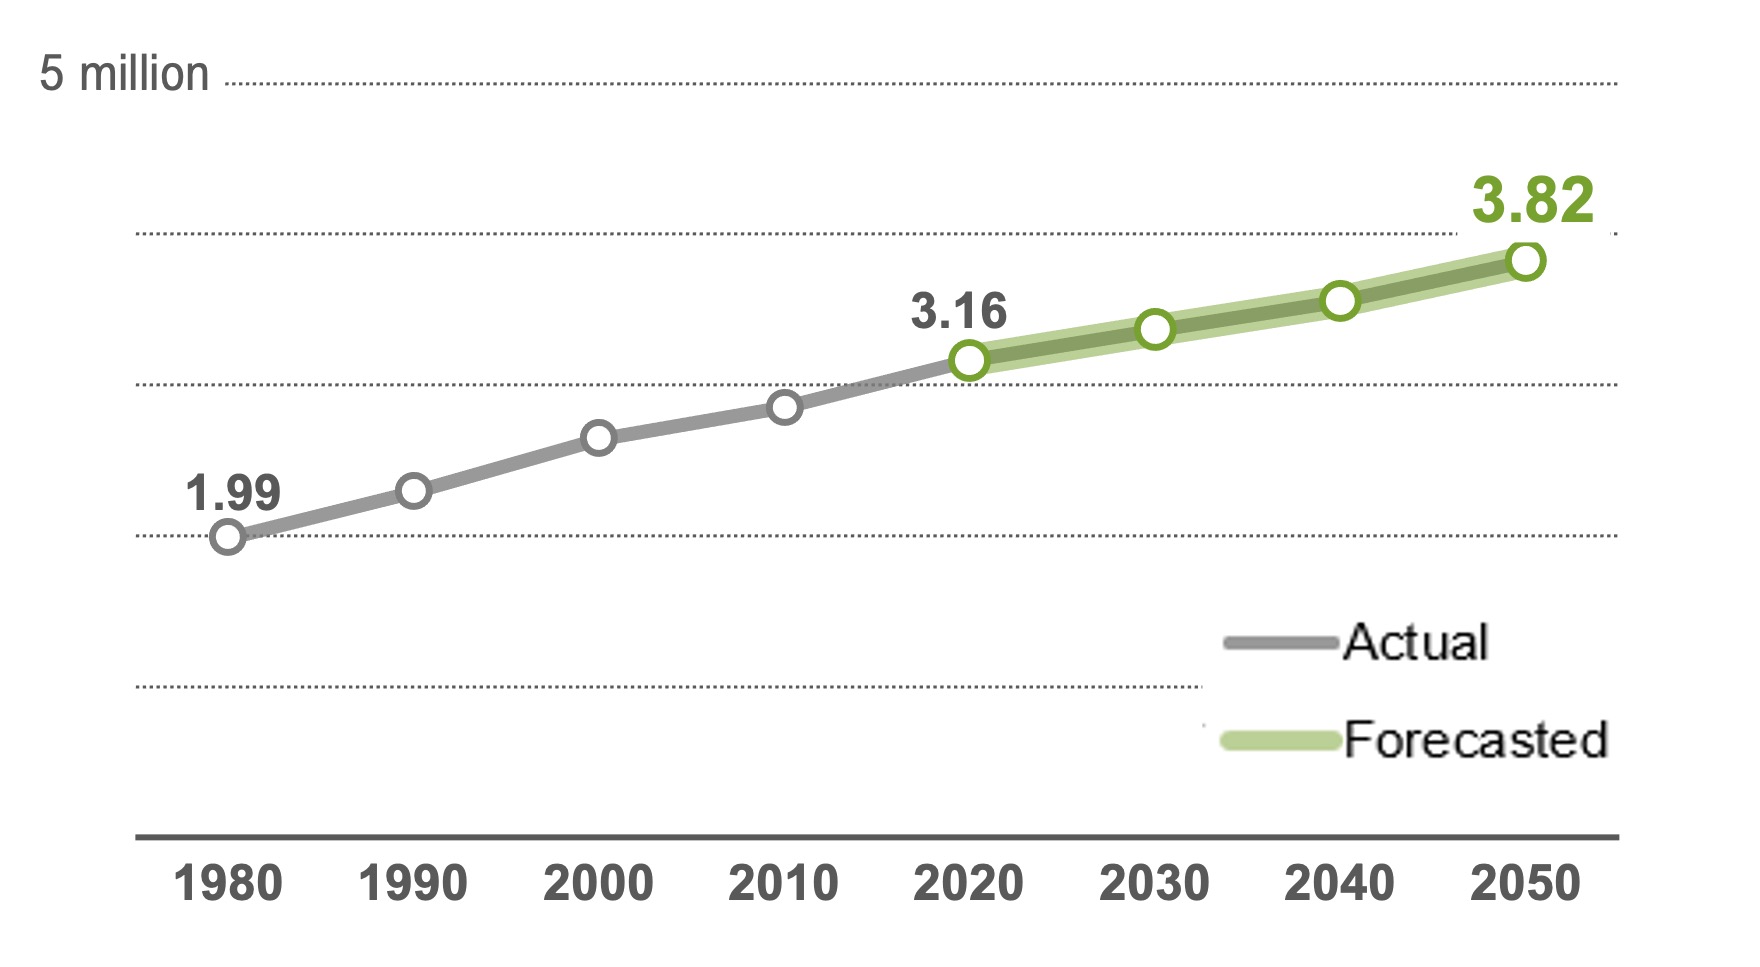
Bill Lindeke's 2024 MinnPost article caught the Met Council while it was refining preliminary forecasts. The final local forecasts were adopted with the regional guide Imagine 2050 in February 2025. For population and households, the official regional forecast uses 2020 as its baseline and projects roughly 657,000 additional residents and 324,000 additional households by 2050. The current local-forecast summary separately describes about 342,000 job gains over its thirty-year planning horizon. Because employment was temporarily depressed in 2020, this reading treats the job figures below as forecasted levels rather than presenting the simple 2020-to-2050 subtraction as the official job-growth estimate.
Watch four metro-region numbers describe the same future
These figures describe the seven-county Twin Cities metropolitan region, not the state of Minnesota. The region consists of Anoka, Carver, Dakota, Hennepin, Ramsey, Scott, and Washington counties. Population, households, employment, and household size are related, but they do not move in lockstep.
The 2020 Census gives the model its starting landscape. From here, economic and demographic assumptions are carried forward, then distributed through the region.
Bar lengths compare each year with the 2050 forecast, not with a universal maximum.
More front doors than the population number suggests
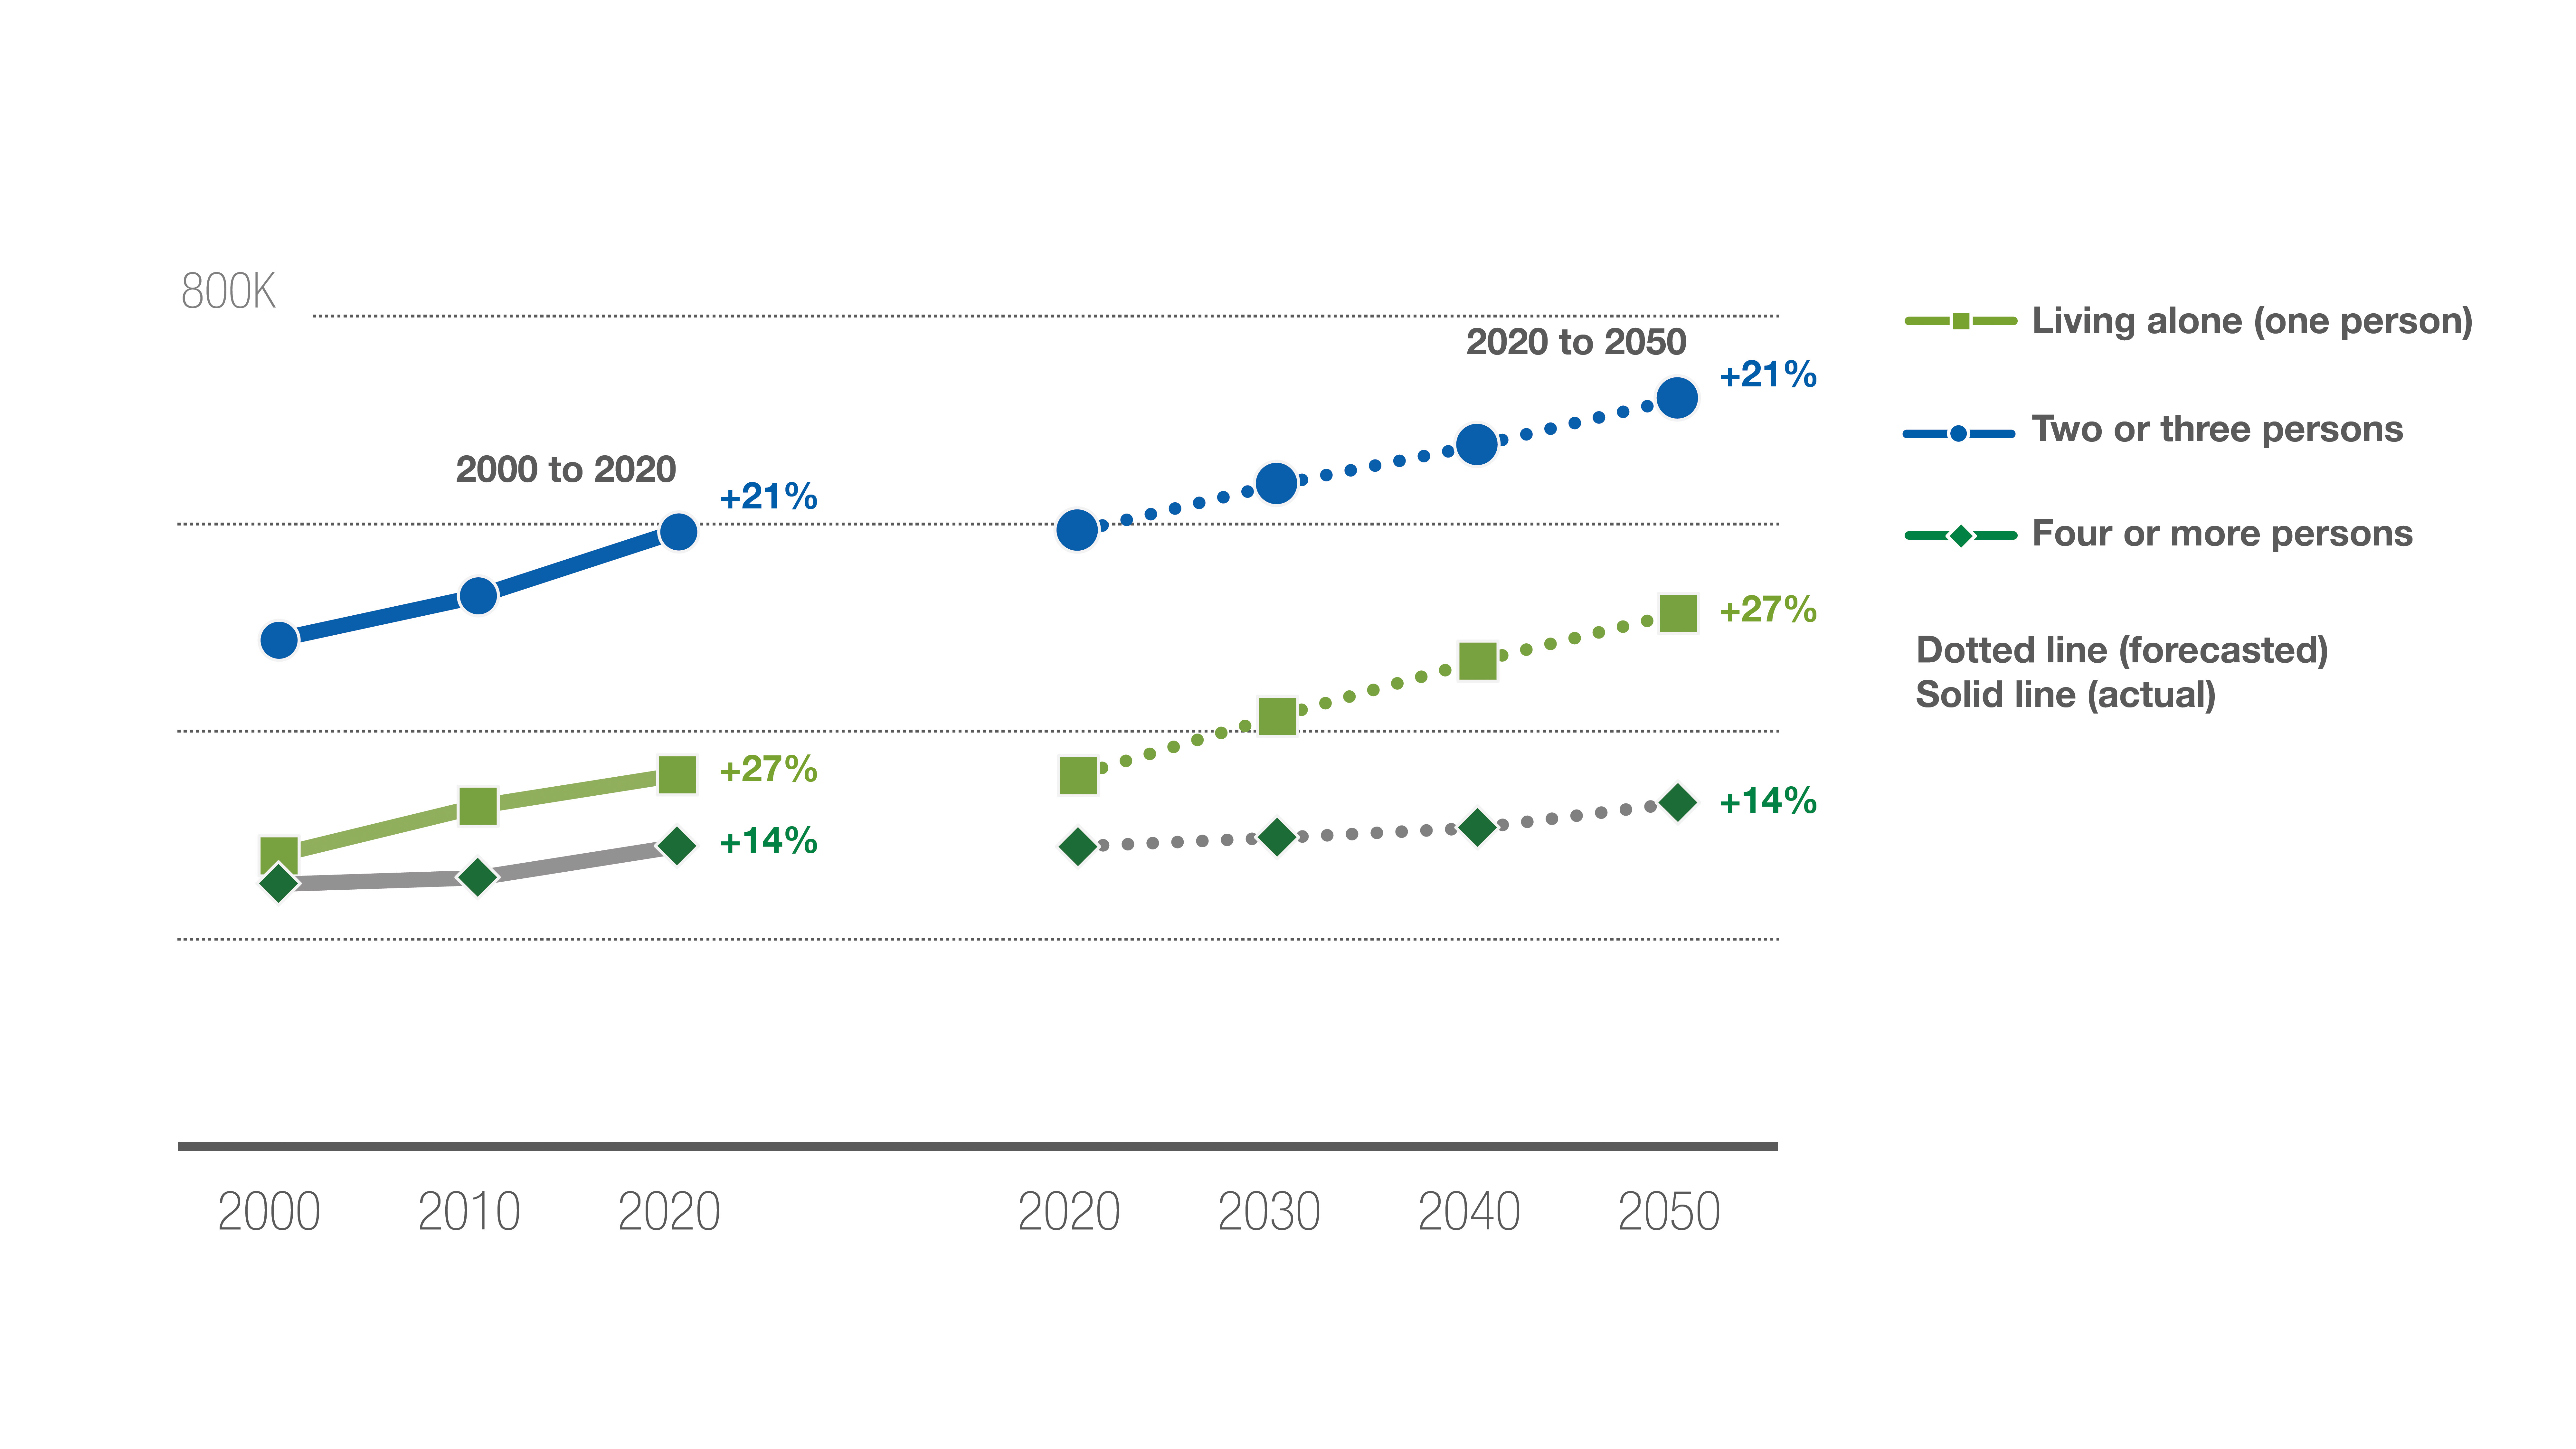
Suppose a region adds people. Obviously it needs more homes. But now suppose the average household also becomes smaller because more older adults live alone, fewer families have many children, and more households form with one or two people. The region then needs additional front doors even before another person arrives.
This is one reason the household forecast matters so much. The Metropolitan Council forecast used in Lindeke's article projects average household size declining from about 2.50 people in 2020 to roughly 2.39 by 2050. That may look like a decimal point with delusions of grandeur. Across millions of people, however, it becomes tens of thousands of additional kitchens, bathrooms, leases, mortgages, parking decisions, and addresses.
Change household size and watch housing demand move
Hold the population at 100,000 people. Adjust the average household size. This is a simplified exercise, but it reveals why households can grow faster than population.
At 2.50 people per household, 100,000 residents occupy about 40,000 homes.
Each small house represents about 1,000 households. Gold houses are the additional front doors created by smaller average households.
The center came back, but the edge never went away
The 2010s were the most urban-centered growth decade the Twin Cities had experienced in more than half a century. Minneapolis and St. Paul gained population after long periods of decline. Apartment buildings appeared near rail stations, along commercial streets, and in first-ring suburbs. A region shaped for decades by outward movement rediscovered the center.
But the center is not an infinite supply of empty land. New buildings there usually require redevelopment, infill, assembly of parcels, taller construction, or replacement of something already present. Those projects are possible, but they are complicated. At the suburban edge, a cornfield may be politically difficult and environmentally consequential, yet physically much easier to subdivide.
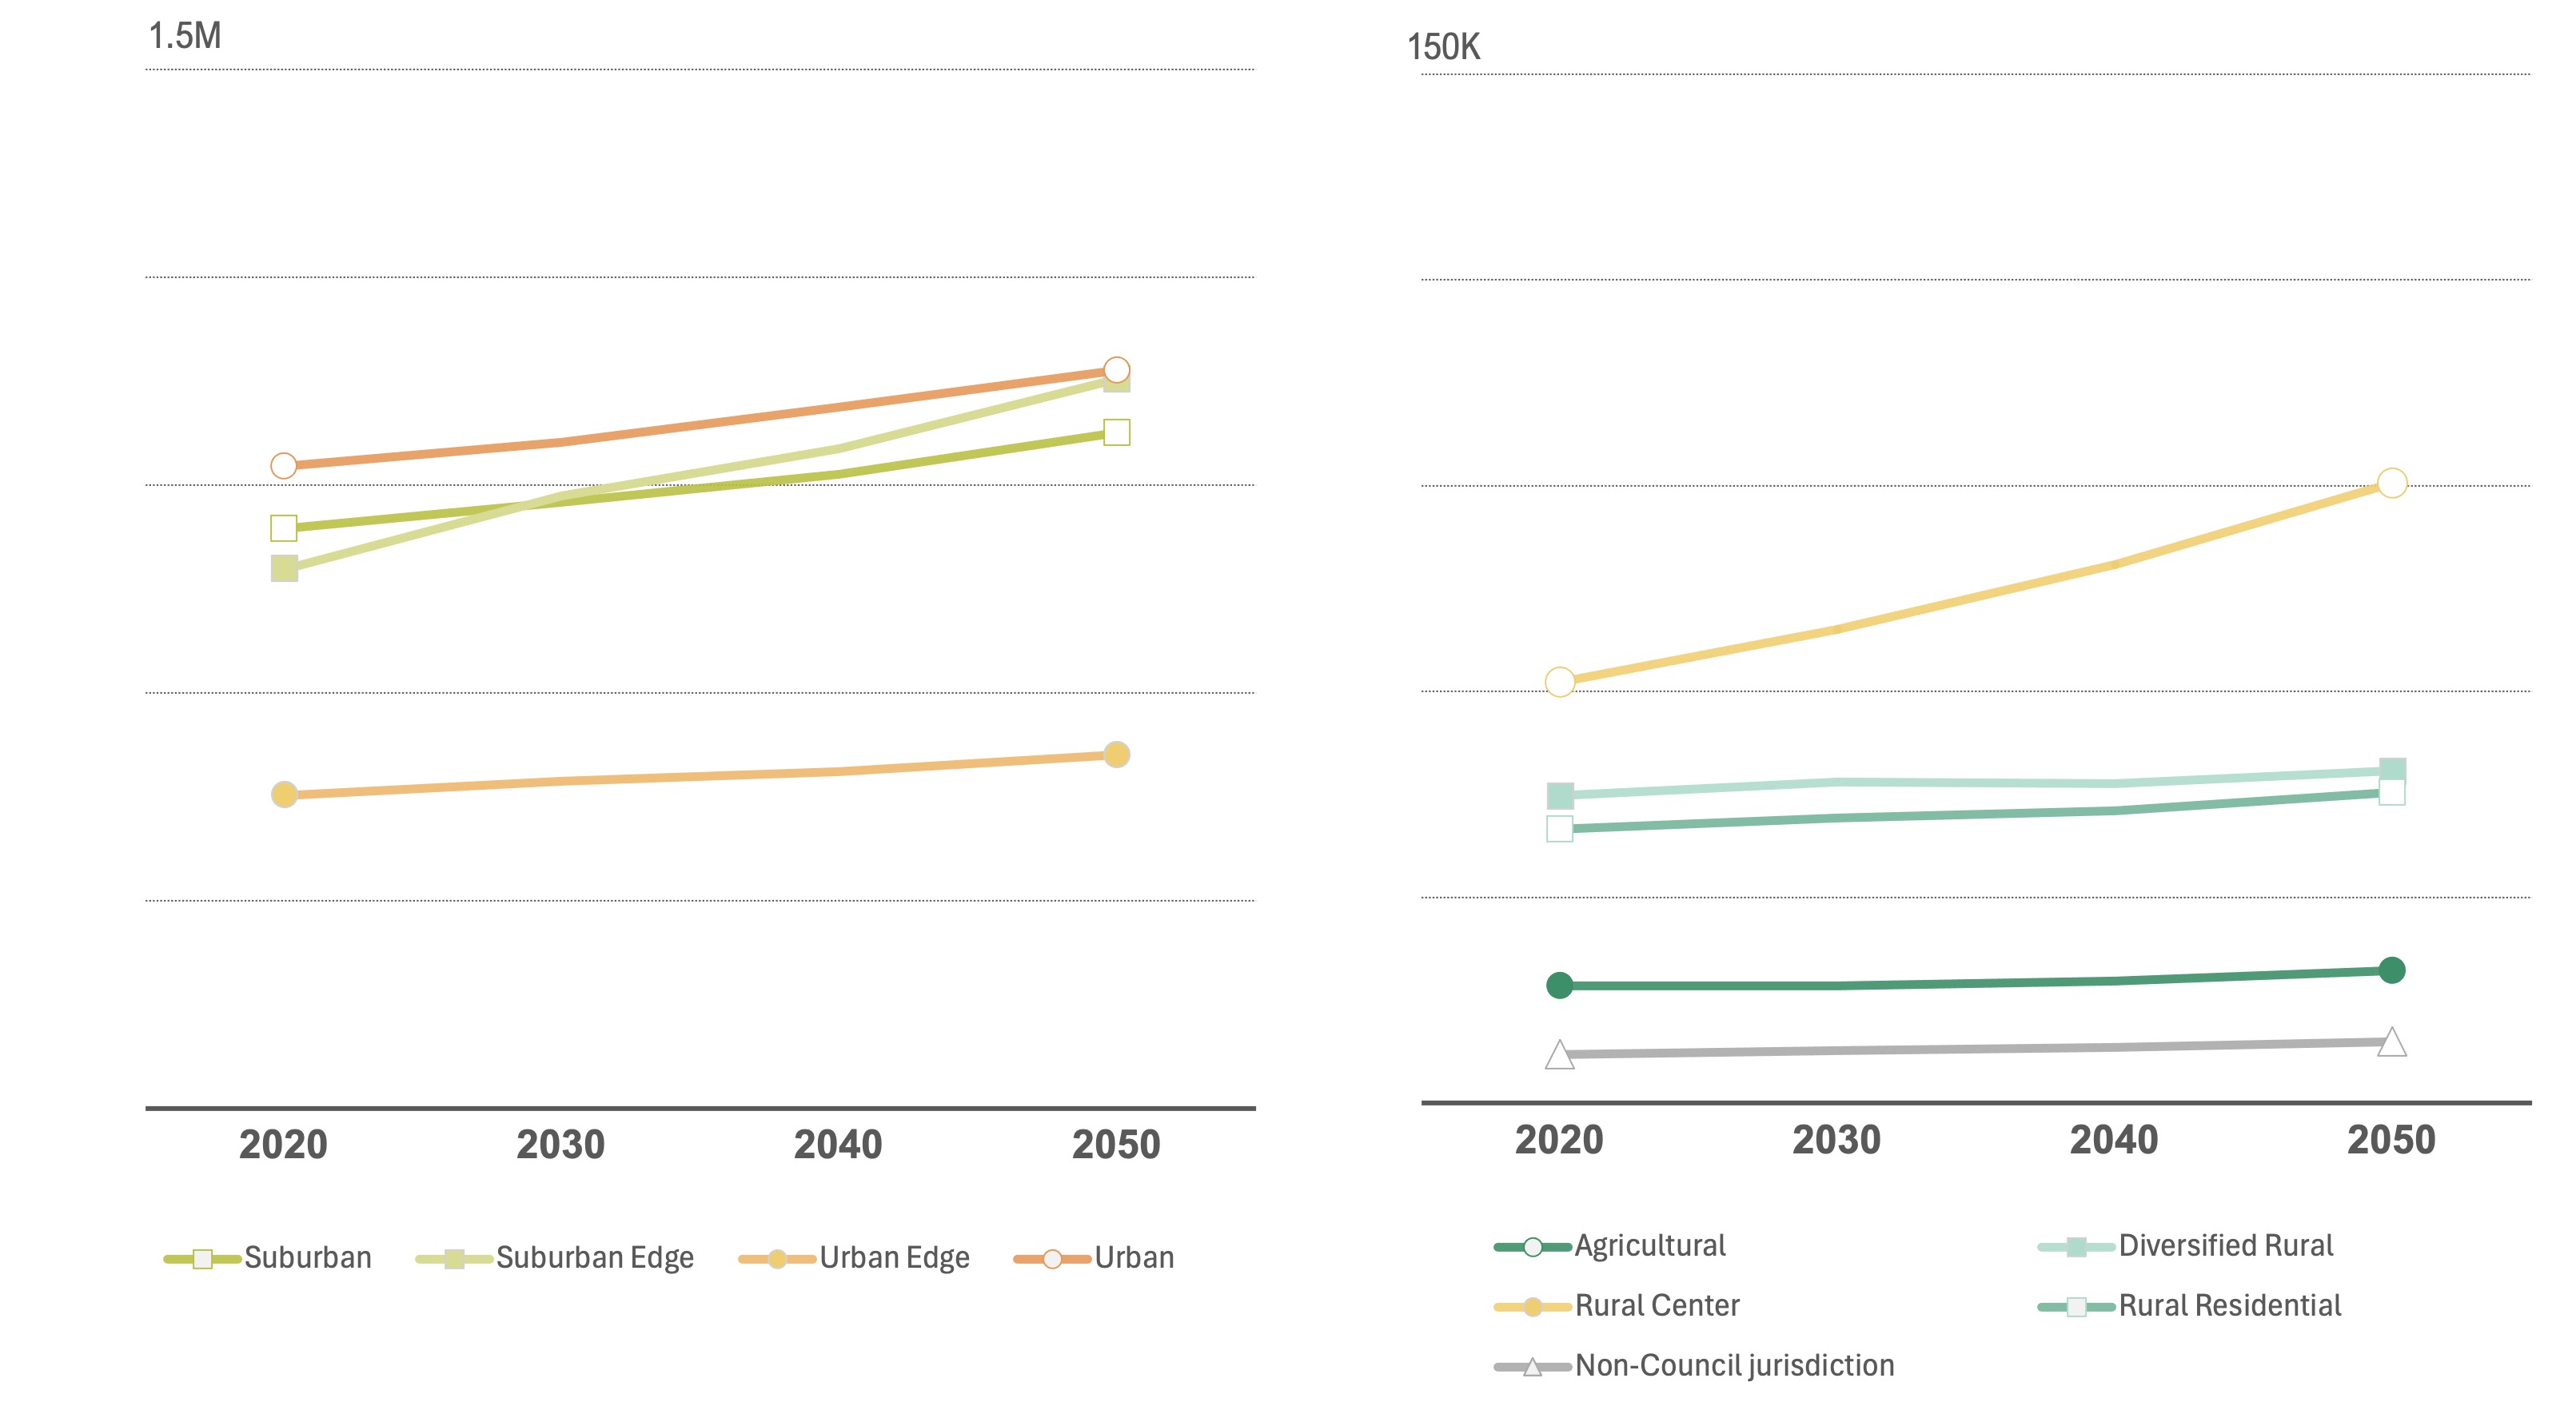
The final 2050 forecasts therefore lean somewhat more toward the suburbs than the 2010s did. Of the region's projected net household growth, about 33 percent is assigned to urban and urban-edge communities, 23 percent to suburban communities, 38 percent to suburban-edge communities, and 6 percent to rural communities. That does not mean the center stops growing. It means every part of the metropolitan machine is expected to participate.
Click outward through the forecast
This is a conceptual planning diagram, not a street map. It turns the final household-growth distribution into four metropolitan zones.
The central cities and nearby developed communities grow mainly through redevelopment, infill, and greater density. This zone still receives about one-third of net household growth, a remarkable contrast with the population losses of the late twentieth century.
Approximate household counts apply the published shares to 324,000 net new households and are rounded.


The forecast is a machine made of assumptions
The regional forecast begins with economic competitiveness. Jobs attract workers. Workers form households. Households need housing. The local forecast then tries to place that demand across the metropolitan landscape using recent real-estate behavior, accessibility, land-use policy, infrastructure, and the probability that development will actually occur.
Each step is reasonable. Put them together, however, and one small change can travel a long way. A stronger labor market may increase migration. More immigration may expand the workforce. More older adults living alone may increase housing demand even with slower population growth. A transit station or wastewater extension may make one district practical. A zoning change may allow the same ten acres to hold sixty homes or six hundred.
Build the metropolitan forecast machine
Select the forces you want the model to notice. The gauges are conceptual, not official forecast values. They show direction and interaction rather than pretending to calculate 2050 on a web page.
Economic demand, migration, smaller households, local policy, infrastructure, and large development sites all shape the forecast. No single factor writes the future alone.
A model is useful precisely because it makes assumptions explicit enough to challenge.
One parcel can make a city surprise the model
Wide-angle forecasts are good at seeing regular patterns. They are less comfortable with a single 427-acre site capable of changing a small city's population by tens of percent. Rice Creek Commons in Arden Hills, the former Twin Cities Army Ammunition Plant site, is that kind of exception.
The land has moved through several identities: wartime factory, contaminated brownfield, redevelopment puzzle, political argument, and planned mixed-use community. In 2024, the approved development framework increased the site's maximum housing capacity from 1,460 to 1,960 units and required at least 20 percent of the total to be affordable rentals at 60 percent of area median income or below. The first actual development broke ground in April 2025, but it was not housing: Micro Control Company's 157,000-square-foot headquarters began construction on the commercial Outlot A. Meanwhile, the preliminary agreement with the developer for the much larger California Parcel expired in June 2025, and the Joint Development Authority spent 2026 working through the next development process while public infrastructure planning continued.
A regional model may allocate growth to Arden Hills. The parcel decides whether that allocation becomes a street.


Move Rice Creek Commons through time
The site begins as a vast industrial landscape. Employment and production dominate; housing is not the question yet.
The grid is conceptual. It represents changes in land-use function, not the actual parcel plan.
Policies establish the envelope of what is possible
A forecast can place one thousand households in a community. It cannot create zoning capacity or make those homes legal. That depends on local plans, zoning districts, height limits, parking rules, approval procedures, infrastructure, and politics. The model therefore studies recent development and local policy, but policy is not a passive input. It can change during the forecast period.
Minneapolis 2040, in effect since 2020, expanded the places where middle- and higher-density housing could be considered. The city is now developing Minneapolis 2050. As of August 2026 the city is in the vision-and-goals phase, with plan development scheduled for 2027, local review and adoption in 2028, Metropolitan Council review in 2029, and the new plan taking effect January 1, 2030. Planning never quite finishes because the future never stops moving away from the plan written for it.
Change allowable density, change the metropolitan capacity
Select a housing form. The exercise uses 2.39 people per household, the Metropolitan Council's 2050 average, to reveal how local rules shape the number of people a site can accommodate.
Ten acres hold about ten homes. This may fit one local vision, but it uses a great deal of land for relatively few households.
This is a capacity demonstration, not a recommendation that every site should reach maximum density.
The first report card arrives before 2050
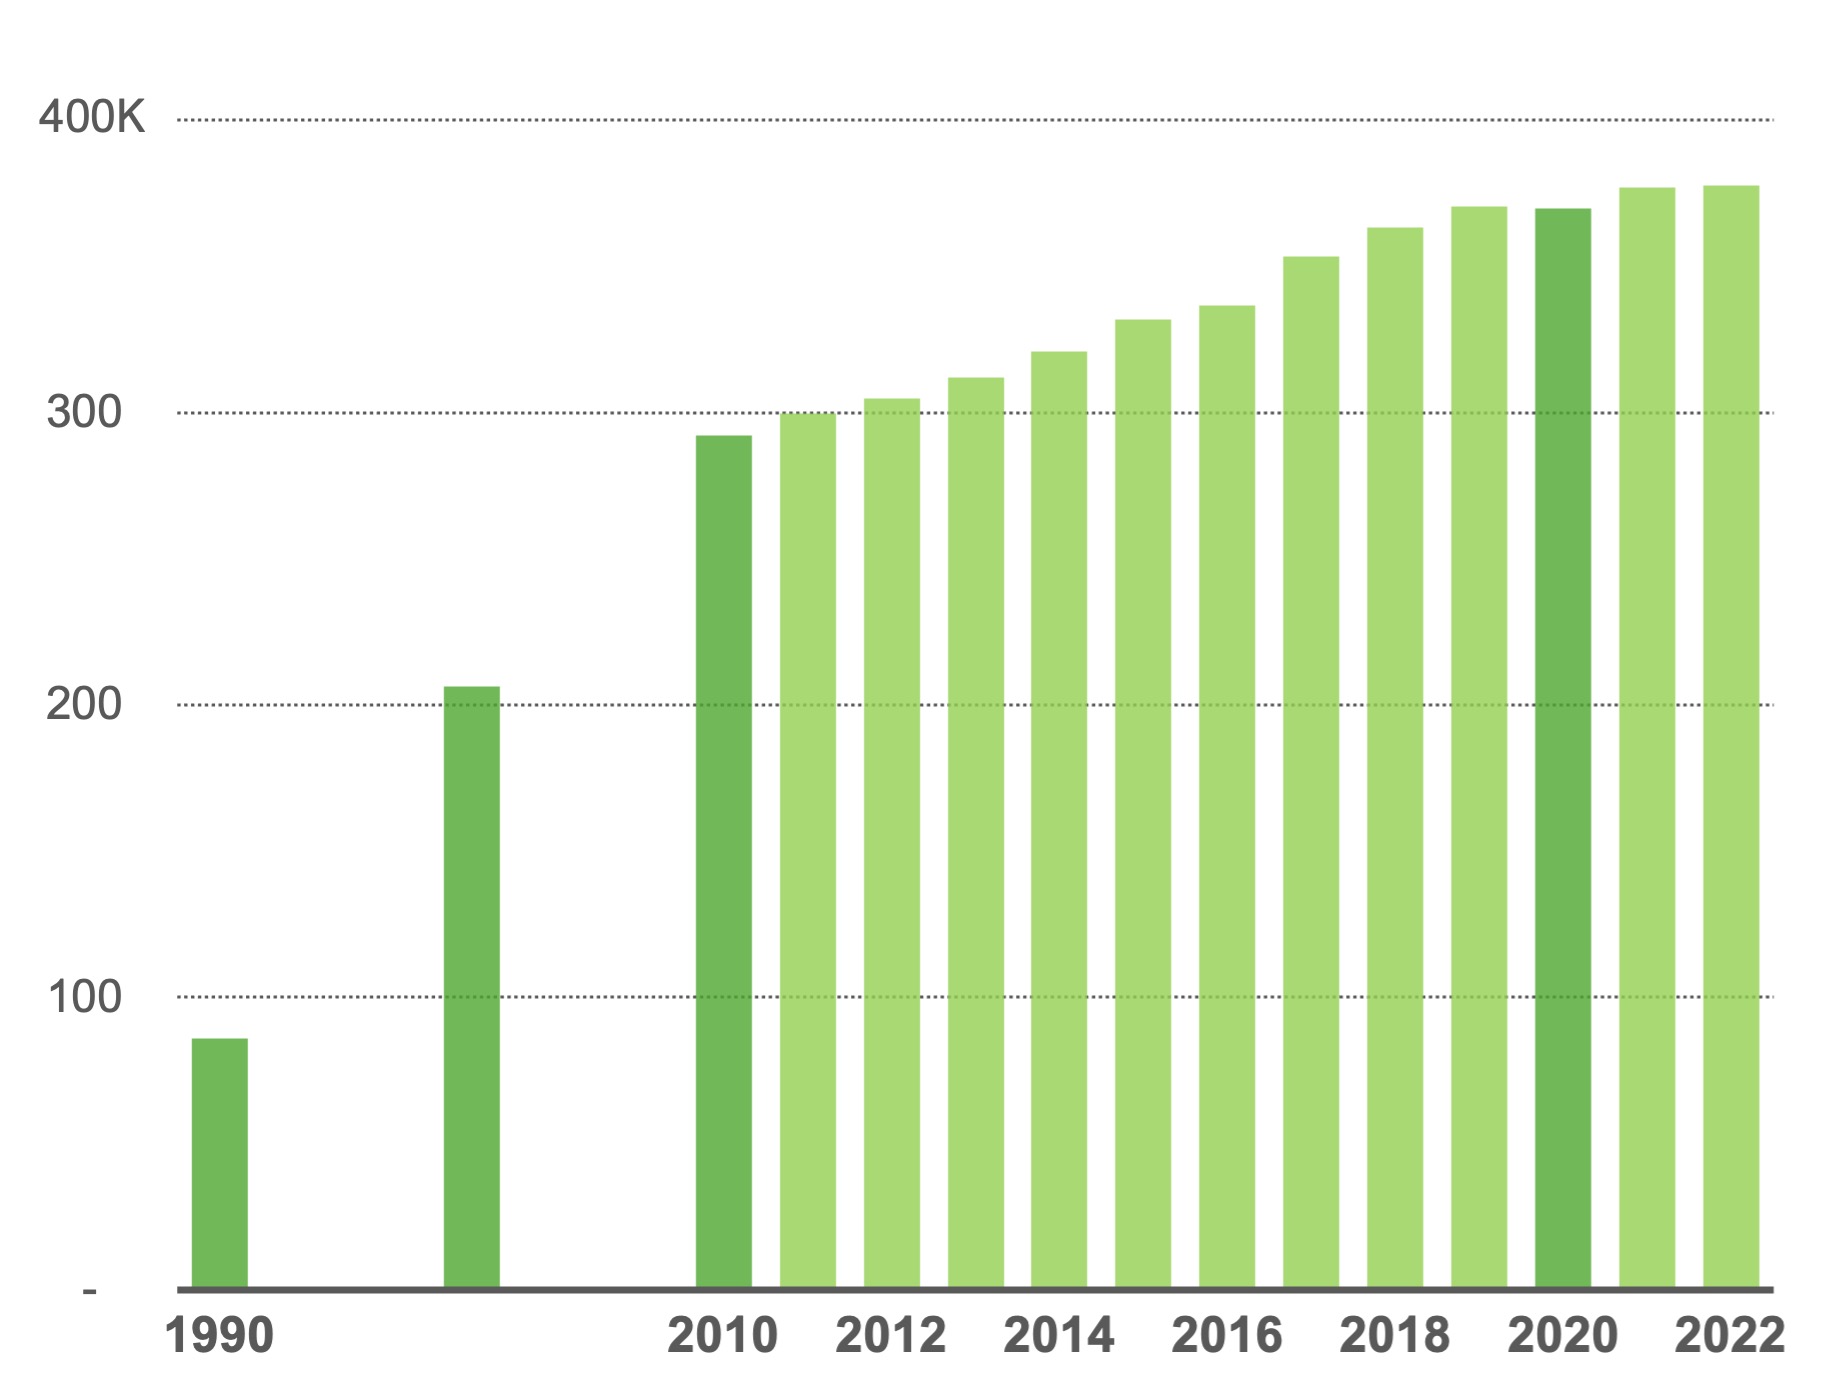
Forecasts do not have to wait thirty years to be challenged. The Met Council's annual estimates show that from 2020 through 2024, the region's population increased about 2.7 percent, households increased 5.2 percent, and housing units increased 6.5 percent. Population growth was substantially slower than in the 2010s, even while housing production remained strong.
That is a useful correction to a familiar story. A region can build many units and still grow slowly if births decline, deaths rise, households become smaller, vacancies increase, or fewer people move in than expected. Housing supply matters enormously, but it is not the only dial on the machine.
The workers in the forecast have to come from somewhere
Lindeke's article ends by asking whether the Twin Cities can attract enough newcomers to sustain its labor force. This is where the immigration reading and the metropolitan forecast touch. The history of Hmong, Somali, Mexican, Indian, African, Asian, Latin American, and European settlement explains how migration networks form. The forecast asks what the region's economy would look like without continued international migration.
The Met Council expects international immigration to account for nearly half of forecast population growth through 2050, approximately 311,000 people. Meanwhile, the aging of the baby boom generation removes workers from the labor force and increases the number of older households. Immigration is therefore not an ornamental detail in the model. It is part of the mechanism that allows employment growth and population growth to continue together.
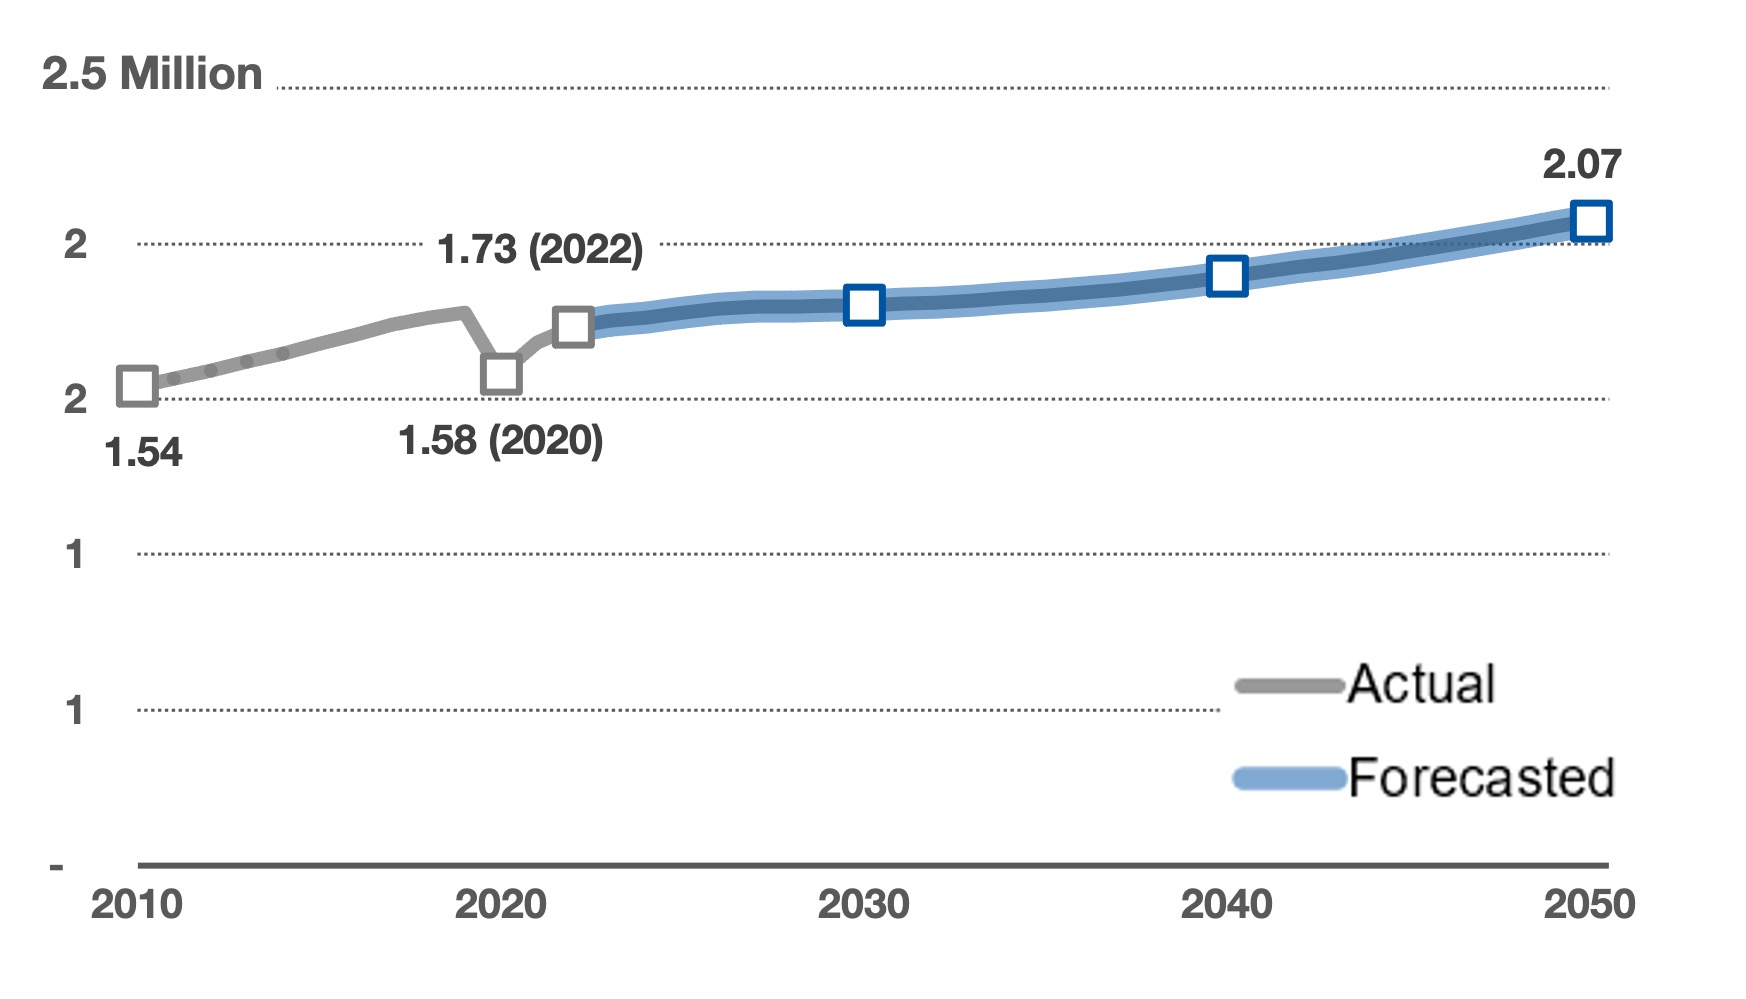
The future is not predicted once. It is negotiated repeatedly.
Lindeke's article began with a fortune teller. It ends with a horizon. Both images are useful, but the second is better. A horizon is real, measurable, and always ahead of you. You can walk toward it, build roads toward it, zone land in anticipation of it, and argue about whether the route should pass through an apartment district or a soybean field. You simply cannot arrive there and declare the job finished.
The Twin Cities forecast is best understood as a shared regional hypothesis. It says that economic opportunity, migration, aging, smaller households, and existing development patterns are likely to produce a larger and somewhat more suburban region by 2050, while the central cities continue growing through infill and redevelopment. It asks every local government to reserve enough legal and physical capacity for its share of that future.
But a zoning ordinance can change. A rail line can open. A pandemic can alter household formation. A giant parcel can stall for fifteen years and then move quickly. A refugee community can create new migration networks. A housing form that seemed risky can become normal once three successful examples exist nearby.
What to carry forward
Planning timeline
Glossary
Quick check
1. Why can household growth exceed population growth?
2. Which zone receives the largest share of projected net household growth?
3. What does zoning change most directly?
4. Why is immigration central to the forecast?
5. What is the best description of a forecast?
Works Cited & Further Reading
Foundational Works for the Minnesota Reader
Hart, John Fraser, and Susy Svatek Ziegler. Landscapes of Minnesota: A Geography. Minnesota Historical Society Press, 2008.
Adams, John S., and Barbara J. VanDrasek. Minneapolis-St. Paul: People, Place, and Public Life. University of Minnesota Press, 1993.
Tester, John R. Minnesota's Natural Heritage: An Ecological Perspective. University of Minnesota Press, 1995.
Twin Cities Public Television and Bell Museum of Natural History. Minnesota: A History of the Land. Four-part documentary series, 2005.
Sources Used and Updates for This Reading
Lindeke, Bill. "Trying to Forecast Growth in the Twin Cities Metro as Demographics Shift." MinnPost, November 4, 2024.
Metropolitan Council. Regional Forecast to 2050, 2023 update; next regional update announced for September 2026.
Metropolitan Council. Local Forecasts to 2050, adopted February 12, 2025.
Metropolitan Council. Imagine 2050: Regional Vision, Values, and Goals, including population, household-size, immigration, race/ethnicity, and employment forecasts.
Metropolitan Council. Annual Population and Household Estimates. Final 2025 estimates were published in July 2026; the 2020-2024 comparative growth figures are retained in this reading as the Council's published trend summary.
City of Arden Hills and Ramsey County. Rice Creek Commons / TCAAP redevelopment materials, including the 1,960-unit development framework, 20% affordability requirement, April 2025 Micro Control groundbreaking, and 2026 redevelopment-process updates.
City of Minneapolis. Minneapolis 2050 Comprehensive Plan, current timeline and August 2026 planning status.
Visual Sources
Imagine 2050 charts are linked to Metropolitan Council source pages through each figure. Minneapolis, Plymouth, construction, and Twin Cities Ordnance Plant photographs are from Wikimedia Commons and are credited in captions.


Comments
Post a Comment