8.1 Housing, Race, and the Geography of Opportunity The Lines Nobody Could See
The Lines Nobody Could See
How the Twin Cities built segregation out of front lawns, property deeds, mortgages, court decisions, highways, and the deceptively ordinary question of who gets to say, “This is home.”
A city can draw a boundary with a river. It can draw one with a railroad, a freeway, or a fence. Minneapolis discovered something cheaper in the early twentieth century: a sentence in a deed. Once that sentence existed, people did not have to stand on a lawn and shout nearly as often. The paper could do some of the shouting for them.
By the end of this reading, you should be able to:
- Explain how private housing discrimination became a durable spatial system through deeds, finance, law, and development.
- Distinguish racial covenants, HOLC residential-security mapping, and FHA mortgage underwriting rather than treating them as one policy.
- Trace how unequal access to homeownership can affect property appreciation and intergenerational wealth.
- Connect the destruction of St. Paul's Rondo neighborhood to earlier patterns of housing segregation without reducing the freeway story to a single cause.
- Use maps and present-day housing data to explain why an abolished rule can leave a measurable geographical legacy.
Before the Invisible Wall
Minneapolis liked to think of itself as different from the Jim Crow South, and there was some evidence for the claim. Minnesota had civil-rights laws covering public accommodations before the twentieth century, and Black political figures such as Frank Wheaton could win office with many white voters. Around 1910, Black Minneapolitans were not yet confined to one rigidly bounded district. Families were living around Lake Harriet, along West River Road, on the east side, and in other parts of the growing city.
That mattered because segregation is easier to mistake for something natural after it has been on the map for a few generations. In 1908 it was not natural at all. You can watch people manufacture it almost in real time in Prospect Park, where Madison and Amy Jackson moved into a house in a desirable neighborhood near the University of Minnesota and the Mississippi River.


The neighbors did not object quietly. Meetings were held on the Jackson lawn. Committees arrived to tell the family that white children would not play with Black children. When William and Daisy Simpson sought to build nearby, the conflict escalated. In October 1909, about 125 white residents gathered at the Jackson home and read a prepared statement telling the families they were not wanted.
And then came one of those small historical moments that reveals the machinery. The crowd was powerful, but crowds are inconvenient. People must organize them, stand outside, risk publicity, and threaten their neighbors face to face. Within months, Minneapolis real-estate developers began using a tool that could make the boundary quieter, repeatable, and attached to the land itself.
The Sentence That Became a Neighborhood
A covenant is simply a restriction attached to property. Covenants can regulate setbacks, building materials, or what kind of structure can occupy a lot. Racial covenants took that ordinary legal instrument and used it to decide who could buy, lease, or occupy a home. Early Minneapolis clauses sometimes contained elaborate lists drawn from the racial theories of their era; later versions often reduced the idea to a blunt declaration that only white people could occupy the property.
The important point is not merely that hateful words existed in old paperwork. The words changed the market. Developers bought farmland at the urban edge, divided it into lots, and attached racial restrictions as the lots entered the property system. The covenant then traveled with the deed. What one developer wrote could shape a neighborhood long after the developer had moved on or died.
Keep the city in place. Change the tool.
Click through the stages. The landscape below is conceptual, but the sequence is historical: direct intimidation becomes a property restriction, then a legally and financially supported geography, then suburban exclusion and freeway infrastructure, and finally a landscape people are trying to document and repair.
Making the Hidden System Visible
For most homeowners, the covenant eventually became almost invisible. It sat in an abstract or deed packet that people might never read. That is why Mapping Prejudice had such a peculiar research problem: the evidence existed everywhere, but it was buried page by page inside millions of property records. Penny Petersen began finding covenants the old-fashioned way, by reading deeds. The University of Minnesota project then combined digitization, optical character recognition, computer searching, volunteer transcription, and mapping.
The project began in 2016 as an experiment. Mapping Prejudice now reports 42,000 covenants mapped with help from 8,200 volunteers contributing about 40,000 hours. Its current downloadable data covers seven Minnesota counties, while the searchable Twin Cities map allows users to click individual parcels and read the language and date of recorded restrictions.


The Law Gives Paper Muscle
Private discrimination becomes much more powerful when public institutions help enforce it. In 1926, the Supreme Court's decision in Corrigan v. Buckley left private racial covenants standing against a constitutional challenge. The decision did not create segregation, but it allowed courts and property law to continue treating these restrictions as enforceable private arrangements.
In 1948, Shelley v. Kraemer held that state-court enforcement of racial covenants violated the Fourteenth Amendment. The ruling did not instantly erase covenant language from deeds, end private discrimination, or undo the geography earlier exclusions had already helped build; it removed judicial enforcement. In 1953, Minnesota prohibited new discriminatory real-estate restrictions and declared those clauses void. Minnesota's 1961 housing and mortgage-discrimination law took effect at the end of 1962, and the federal Fair Housing Act followed in 1968 with broader national protections.
The human cost is easier to see when you return from the Supreme Court to an ordinary bungalow at 46th Street and Columbus Avenue. In 1931, Arthur and Edith Lee bought a house whose deed did not contain a racial covenant. Arthur was a World War I veteran and a postal worker with a steady paycheck during the Depression. The neighborhood association tried to buy the family out. When the Lees refused, white residents escalated to harassment and mass intimidation.

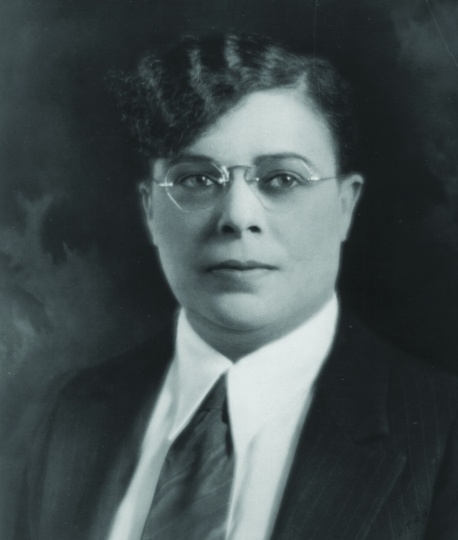
By July 16, more than four thousand protesters and spectators had gathered near the Lee home. Stones were thrown, the house was vandalized, the family dog was poisoned, and the Lees slept in the basement for protection. The family dismissed an attorney who had urged them to sell and hired Lena Olive Smith, who publicly insisted that the Lees would not leave. The violence eventually subsided, though the family endured years of pressure before moving in 1933.
This is why the history is not simply “racist covenants versus brave individuals.” Formal rules and informal violence reinforced one another. A covenant could keep many Black buyers away without anyone appearing on the front lawn. When someone crossed a boundary that paperwork had not secured, neighborhood associations, banks, lawyers, police, politicians, and crowds could still apply pressure.
Then the Mortgage Became a Map
The 1930s transformed American homeownership. The federal government helped stabilize mortgage markets and made long-term, federally supported home finance available to millions of households. The transformation was real, and enormously important. It also took place inside a housing system that treated racial homogeneity as financial security.
Two federal institutions are often blended together in popular retellings, so it is useful to separate them. The Home Owners' Loan Corporation, created in 1933, became associated with the famous residential security maps that graded neighborhoods from A through D. The Federal Housing Administration, established by the National Housing Act of 1934, insured mortgages and developed underwriting standards that reinforced racial exclusion and the use of restrictive covenants. Different agencies, same larger market logic: race was treated as a measure of risk.
Two maps, two historical questions
A covenant map records a private property restriction. A residential-security map records an institutional appraisal. Both matter, but they are not interchangeable and neither one is a complete ledger of every loan, resident, or discriminatory act.
What it maps: recorded racial covenants in Hennepin County, 1910–1955.
Explore Mapping Prejudice maps and data.
A parcel-level historical record of restrictions, not a map of every act of discrimination or every resident.
What it maps: Minneapolis neighborhood appraisals prepared in the 1930s for the federal city-survey system.
Explore the Minneapolis HOLC map and area descriptions.
An institutional appraisal map, not a direct map of every mortgage approval or denial.

Reading the two records side by side helps us distinguish a deed-based mechanism from a federal appraisal geography. The relationship among covenants, HOLC, FHA underwriting, private lending, and local policy was real but not identical.
A map can look technical while carrying a social theory
The federal grading system used four familiar colors. Click each grade and watch how a seemingly neutral label could shape where credit flowed.
Redlining did not mean that every loan in a red area was automatically forbidden or that every household elsewhere received easy credit. The system was messier than that. But the maps, underwriting standards, private lending decisions, and racial covenants reinforced a common message: white neighborhoods were safer investments, while Black presence itself could be treated as evidence of decline. That made the unequal geography of credit look like a technical conclusion rather than a political choice.
The Same Paycheck, a Different Gate
Housing discrimination was not only about where a family slept. In twentieth-century America, a mortgage could also become a savings account, an inheritance, collateral for another loan, or the resource that helped pay for college or retirement. Excluding households from appreciating property did not simply deny them a neighborhood. It could redirect decades of wealth accumulation.
Move two families through the housing system
This is a conceptual comparison, not a reconstruction of two specific households. Both families begin with work and income. The difference is whether the housing market consistently gives them access to the same opportunities.
Home equity opportunity
Home equity opportunity
The GI Bill after World War II illustrates the point. The law itself did not say that housing benefits were for white veterans only. Yet Black veterans often encountered discriminatory banks, real-estate practices, covenants, and white-only suburban markets that blocked them from turning veterans' benefits into the same kind of homeownership opportunity available to many white veterans. A universal-looking benefit entered a racially unequal housing system and produced unequal results.
The Wall Moves Outward
By the middle of the twentieth century, the spread of racial covenants was also the spread of the metropolitan area. As Edina, St. Louis Park, Richfield, Bloomington, and other first-ring suburbs developed, new subdivisions could be blanketed with restrictions from the beginning. Segregation no longer meant only keeping Black households out of selected city blocks. It helped define the expanding white suburban ring.
There were counterexamples. Tilsenbilt Homes in south Minneapolis became an important open-housing development in the 1950s, offering new homes to Black buyers and employing Black construction workers. Civil-rights activists pushed for fair housing at the state legislature, and Minnesota enacted a fair-housing law in 1962. Six years later, Senator Walter Mondale became a central figure in passage of the federal Fair Housing Act.
Yet removing a legal barrier does not rewind a city. By the time explicit housing discrimination was outlawed, neighborhoods, schools, tax bases, property markets, lending networks, and family wealth had already been shaped by decades of unequal access. The invisible line had become embedded in other systems.
Then the Line Became Concrete
In St. Paul, the Rondo neighborhood demonstrates the next transformation. Rondo was a major center of Black life, with homes, churches, businesses, clubs, social networks, and institutions built over generations. When planners chose a route for Interstate 94, an alternative northern route near rail lines existed. The adopted route instead cut through Rondo.


Minnesota Historical Society and Minnesota Digital Library materials use different measures, but they agree that I-94's path through Rondo imposed a devastating loss. One Minnesota Historical Society account estimates that more than seven hundred family homes and about three hundred businesses were demolished or closed; other accounts count displaced families rather than structures. The consequences were not limited to physical displacement. Property was sometimes undervalued during acquisition, business networks were broken, and the accumulated value of family property could disappear with the neighborhood itself.
Rondo is the clearest Minnesota case in this reading. It does not make every Twin Cities freeway project identical, nor does it prove that engineers simply copied a covenant map. It shows instead how a city that had already concentrated vulnerability could make some places politically and financially easier to clear than others.
The Past Does Not Stay in the Past
The most useful way to talk about legacy is not to claim that every present inequality has one historical cause. Cities are more complicated than that. The stronger claim is that housing policy changes the starting conditions inherited by later generations, and those starting conditions can remain visible long after the original rule disappears.

The homeownership gap remains enormous even though the exact numbers have changed. Metropolitan Council reporting using 2024 Census data puts white homeownership in the Twin Cities region at about 75 percent and Black homeownership at about 29 percent. That gap is not a fossil preserved unchanged from 1910. It is a present-day outcome produced by many forces. But the history of who was permitted to buy, where mortgages flowed, where public investment accumulated, and whose property was later displaced is part of the causal landscape.
When the Map Becomes a Tool for Repair
The story takes an unusual turn in the present because the same techniques that reveal the damage are now being used to guide responses. Mapping Prejudice's searchable database lets residents discover whether a parcel carried a racial covenant. Minneapolis operates its Just Deeds program so property owners can formally discharge discriminatory restrictions from their title records at no charge.
In St. Paul, the Rondo Inheritance Fund offers down-payment assistance to qualifying descendants of people who lost property to I-94. Current city rules allow eligible buyers to combine assistance layers reaching as high as $110,000, although the Rondo down-payment program is not accepting new applications as of summer 2026. ReConnect Rondo continues to advance a community land-bridge concept intended to reconnect the neighborhood across the freeway and support housing, green space, cultural activity, and community development.
More Than Bricks and Mortar
Marvel Jackson Cooke's story leaves us with a counterfactual that is worth taking seriously. Her family stayed in Prospect Park despite the threats. As a child, Marvel had white playmates because her father's elaborate playground defeated at least one rule adults had tried to impose. Yet as she grew older, the social boundaries hardened. She eventually decided there was no future for her in Minneapolis and left for Harlem, where she became a major journalist and activist.
What did Minneapolis lose when she left? We cannot map the answer. We cannot calculate the businesses that were never founded, the friendships that never formed, the neighborhoods that never became integrated communities, or the wealth that could not be inherited because a family was prevented from buying a house in the first place. Geography is partly the study of what exists, but sometimes the most haunting geography is made of possibilities that were deliberately closed.
That is why this history is larger than property law. A deed looks like paper. A mortgage looks like finance. A freeway looks like transportation. A suburb looks like housing. Put them in sequence, however, and they begin to reveal a machine for distributing opportunity through space. The machine was built piece by piece, which also means it can be understood piece by piece.
Segregation Lab: Three American Metros
Start with household preference, then add the structural forces this reading documented. Finally, compare why the same mechanisms and policies behave differently in the Twin Cities, Atlanta, and Los Angeles.
The innocent-looking experiment
Two household groups begin in a mostly mixed city. A household moves when too few nearby households belong to its own group. Set a modest threshold and see what many small decisions can produce together.
This is a Schelling-style teaching model. It deliberately starts too simply; the next step shows why preference alone is not an adequate explanation of American segregation.
Now add unequal power
Keep the same household threshold, but change which homes are actually available and who is forced to move. Turn mechanisms on or off, then run the city again.
One nation, three urban anatomies
The same national history enters three different metropolitan structures. Choose a metro, read the stylized pattern, then decide which mechanisms best explain it.
Twin Cities: the spatial inheritance
Choose the three strongest explanations
The same policy does not enter the same city
Spend six policy points. Your package is applied to all three metros, but outcomes differ because inherited geography, housing scarcity, institutional boundaries, and displacement pressure differ.
The geography to carry forward
Glossary
Quick check
Works Cited & Further Reading
Foundational Works for the Minnesota Reader
- Hart, John Fraser, and Susy Svatek Ziegler. Landscapes of Minnesota: A Geography. Minnesota Historical Society Press, 2008.
- Adams, John S., and Barbara J. VanDrasek. Minneapolis-St. Paul: People, Place, and Public Life. University of Minnesota Press, 1993.
- Tester, John R. Minnesota's Natural Heritage: An Ecological Perspective. University of Minnesota Press, 1995.
- Twin Cities Public Television and Bell Museum of Natural History. Minnesota: A History of the Land. Four-part documentary series, 2005.
Sources Used and Updates for This Reading
- Twin Cities PBS. Jim Crow of the North. Documentary on racial covenants, housing segregation, redlining, resistance, and freeway displacement in the Twin Cities.
- University of Minnesota Libraries, Mapping Prejudice. Project overview, maps and downloadable data, and project histories of racial covenants in Minneapolis. Project totals are reported with an access date because the database continues to grow.
- University of Richmond Digital Scholarship Lab, Mapping Inequality: Minneapolis Residential Security Map and Area Descriptions. The original HOLC/FHLBB City Survey scan is public domain through the National Archives; use the 1930s date range unless working directly from a dated sheet.
- Minnesota Historical Society. Racial Housing Covenants in the Twin Cities and Minnesota in the Age of Jim Crow.
- Minnesota Digital Library. Rondo: During and After the Highway. Includes the proposed northern route, I-94 construction, displacement, and property-valuation evidence; counts vary by source and unit of analysis.
- Metropolitan Council. Repairing historic and ongoing harm and the Imagine 2050 Housing Policy Plan. Used for 2023 former redlined/greenlined home values and contemporary regional housing disparities.
- Metropolitan Council. 2025 Regional Economic Framework. Uses 2024 Census data showing about 75% white and 29% Black homeownership in the Twin Cities region.
- City of Minneapolis. Just Deeds. Current city program for discharging racial covenants from property titles at no charge.
- City of Saint Paul. Rondo Inheritance Fund Downpayment Assistance Program. Current program rules allow combined assistance of up to $110,000 for some eligible descendants; applications were closed as of July 2026.
- ReConnect Rondo. Land bridge project progress.
- U.S. Supreme Court. Corrigan v. Buckley (1926) and Shelley v. Kraemer (1948).
- Minnesota Revisor of Statutes. Minn. Stat. § 507.18 (1953); Minnesota Laws 1961, chapter 428 (housing and mortgage-discrimination protections effective December 31, 1962).
- U.S. Department of Housing and Urban Development. Fair Housing Act history and federal fair-housing resources.
Visual Sources
- Mapping Prejudice / University of Minnesota Libraries: covenant maps and covenant/population overlays.
- University of Richmond Digital Scholarship Lab, Mapping Inequality: 1930s Minneapolis residential-security map and area descriptions; original map scan from National Archives City Survey Files (public domain).
- Minnesota Historical Society and Wikimedia Commons: Marvel Jackson Cooke, Arthur and Edith Lee House, Lena Olive Smith, and related historical images.
- Minnesota Digital Library: proposed I-94 route, Rondo freeway construction, and neighborhood-displacement photographs.
- Metropolitan Council Imagine 2050: 2023 home-value map comparing former HOLC Grade A and Grade D areas.


Comments
Post a Comment